Real problems.
Real constraints.
Real outcomes.
We don't ship slideware. Every system below runs in production — moving real data, under real constraints, for real operations. One of them you can open in a new tab and use right now.
 circle Our Own Product · Live
pieBench
The field-operations platform built for smart-meter rollouts.


What We Built
A multi-tenant field-operations platform where every meter installation is verifiable. Agent submits. System flags. Supervisor decides — with full context. Every execution records the agent ID, device, GPS coordinates, timestamp, and the reviewer's approval decision. Completed installations sync straight through to the billing and HES systems.
Inside The App
The Scout mobile app puts the whole workflow in a field agent's hand — go on duty, pick up dispatched work orders, navigate to service points, and capture verified installations offline.
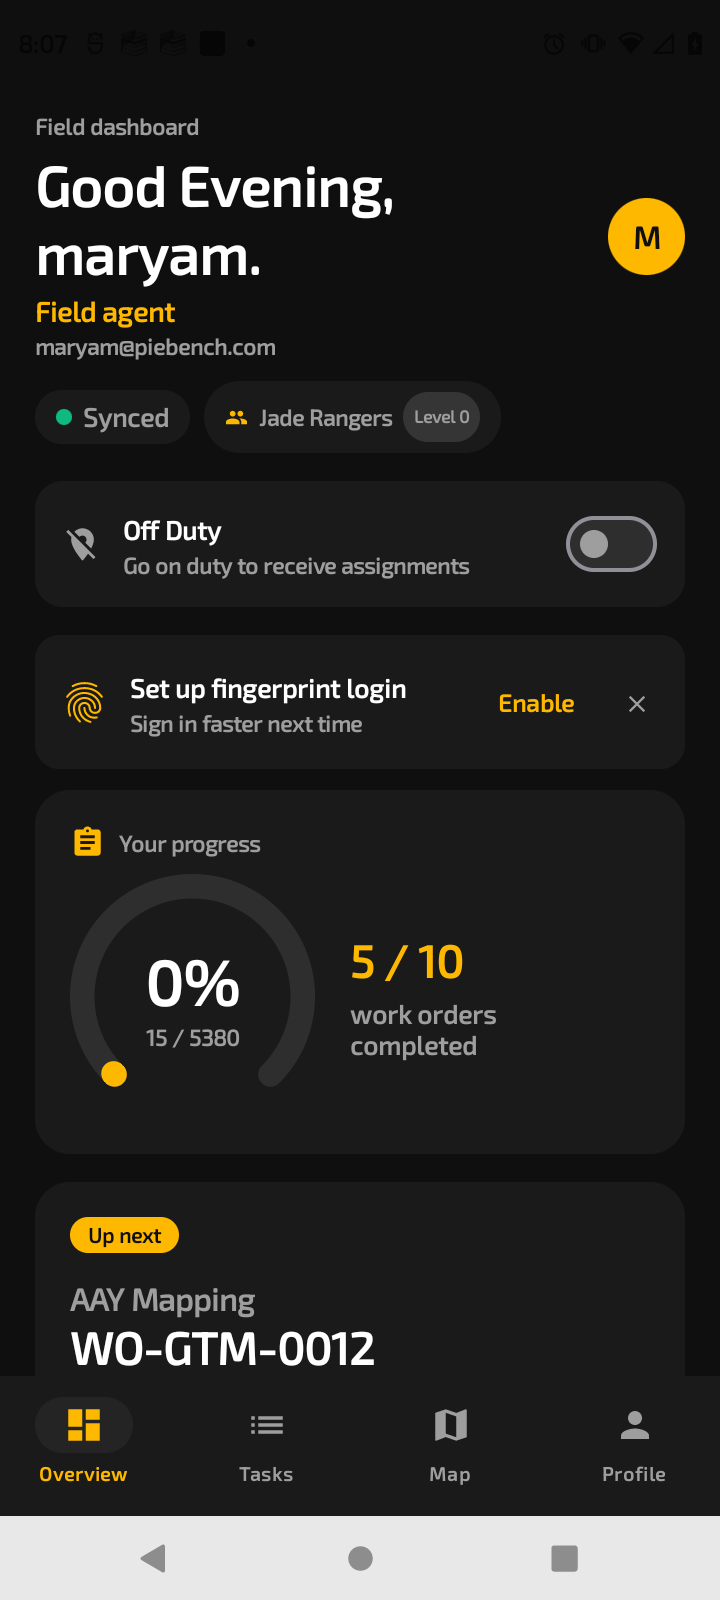
Field-agent dashboard
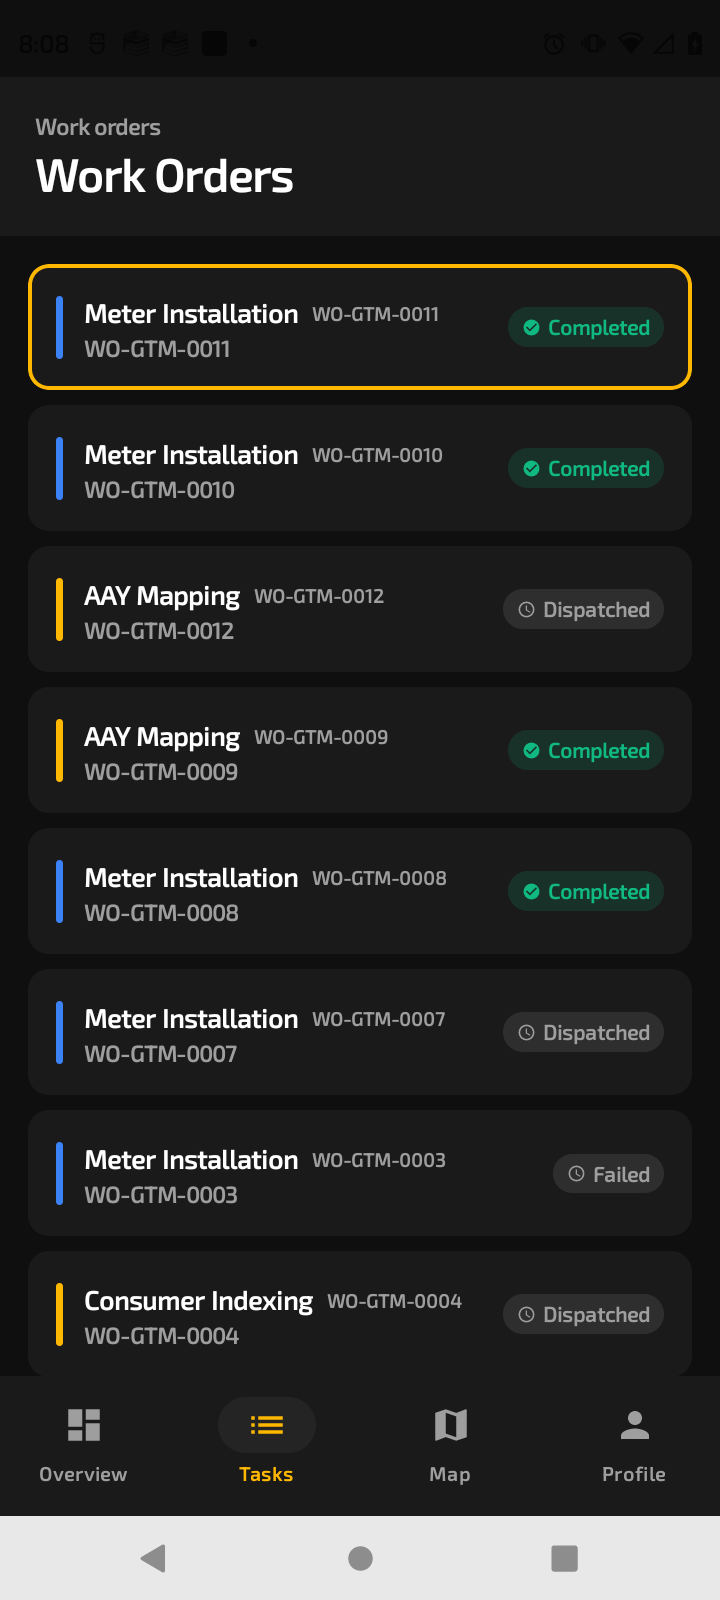
Live work orders
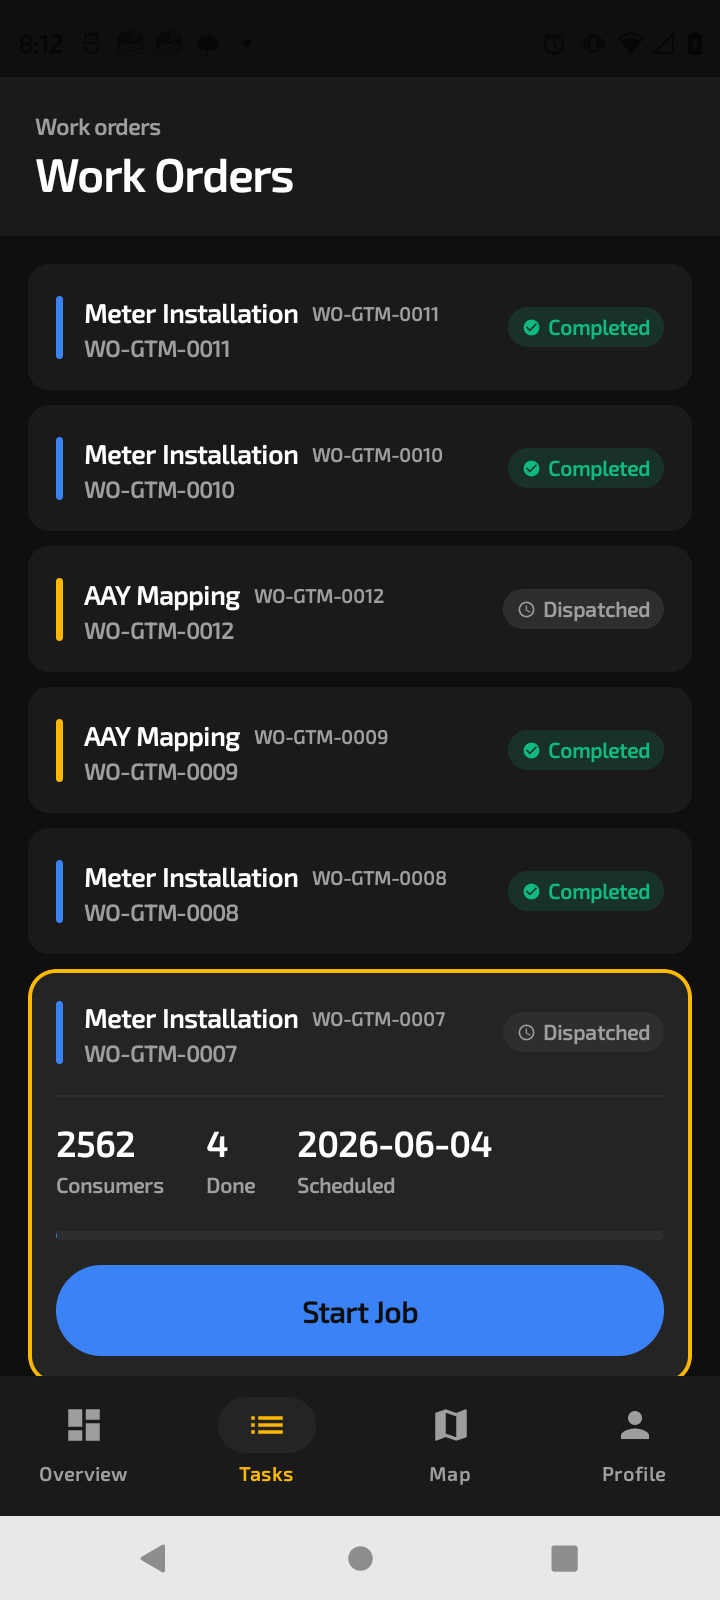
Job — 2,562 service points
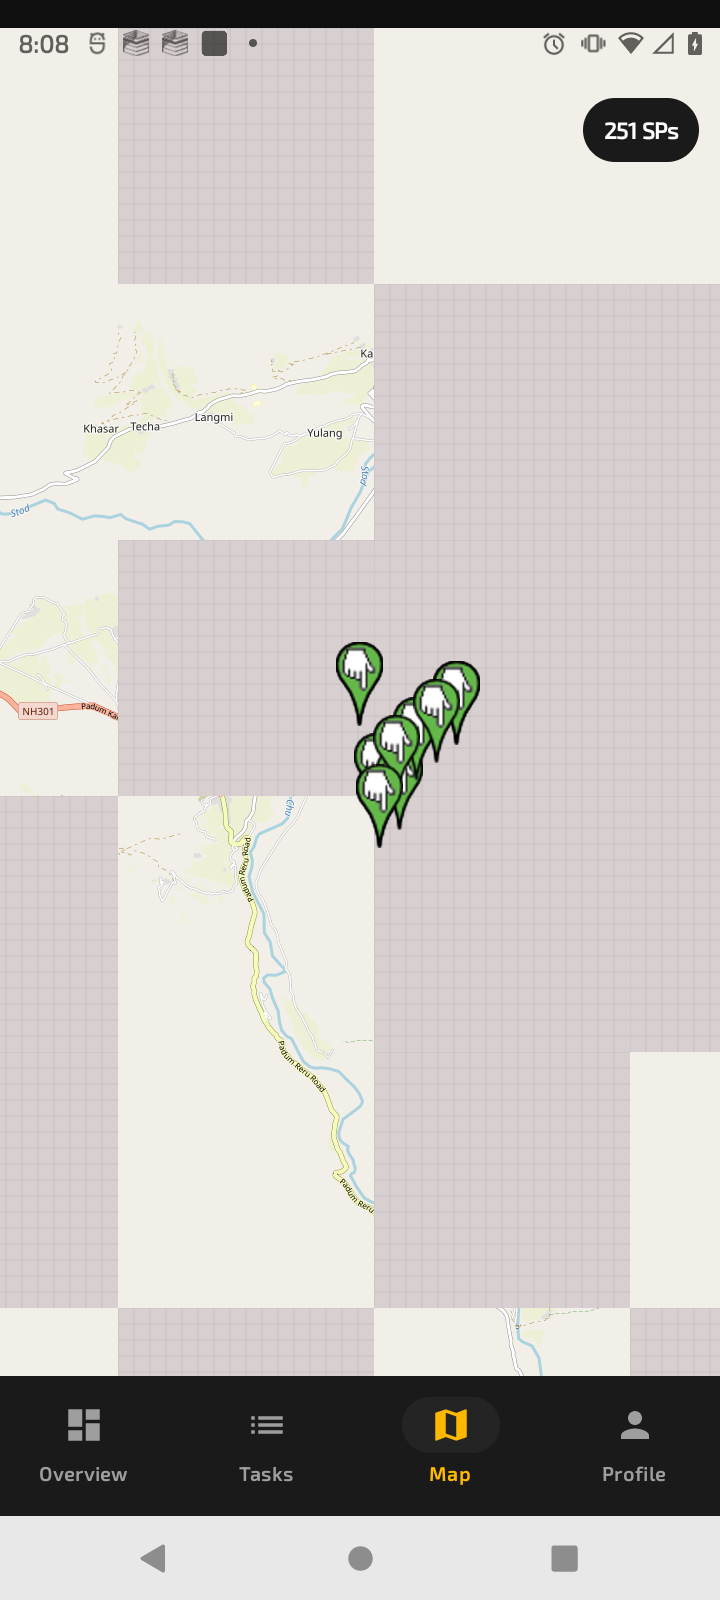
Field map — 251 SPs
The Capture Flow — Every Install, Verified
Scan the new meter, photograph the install, lock the GPS. No proof, no submission — and every field is captured against the service point on the ground.
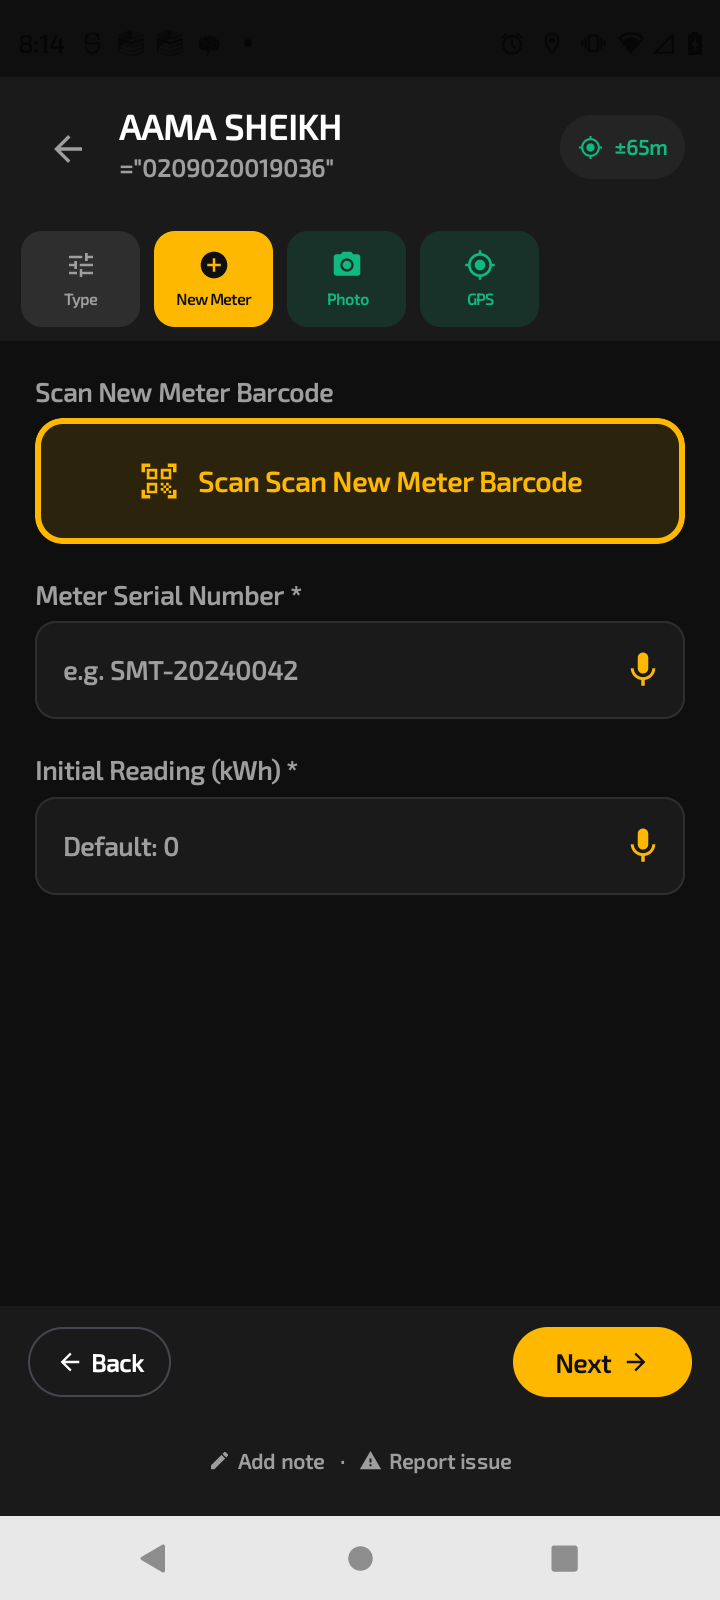
Scan the new meter
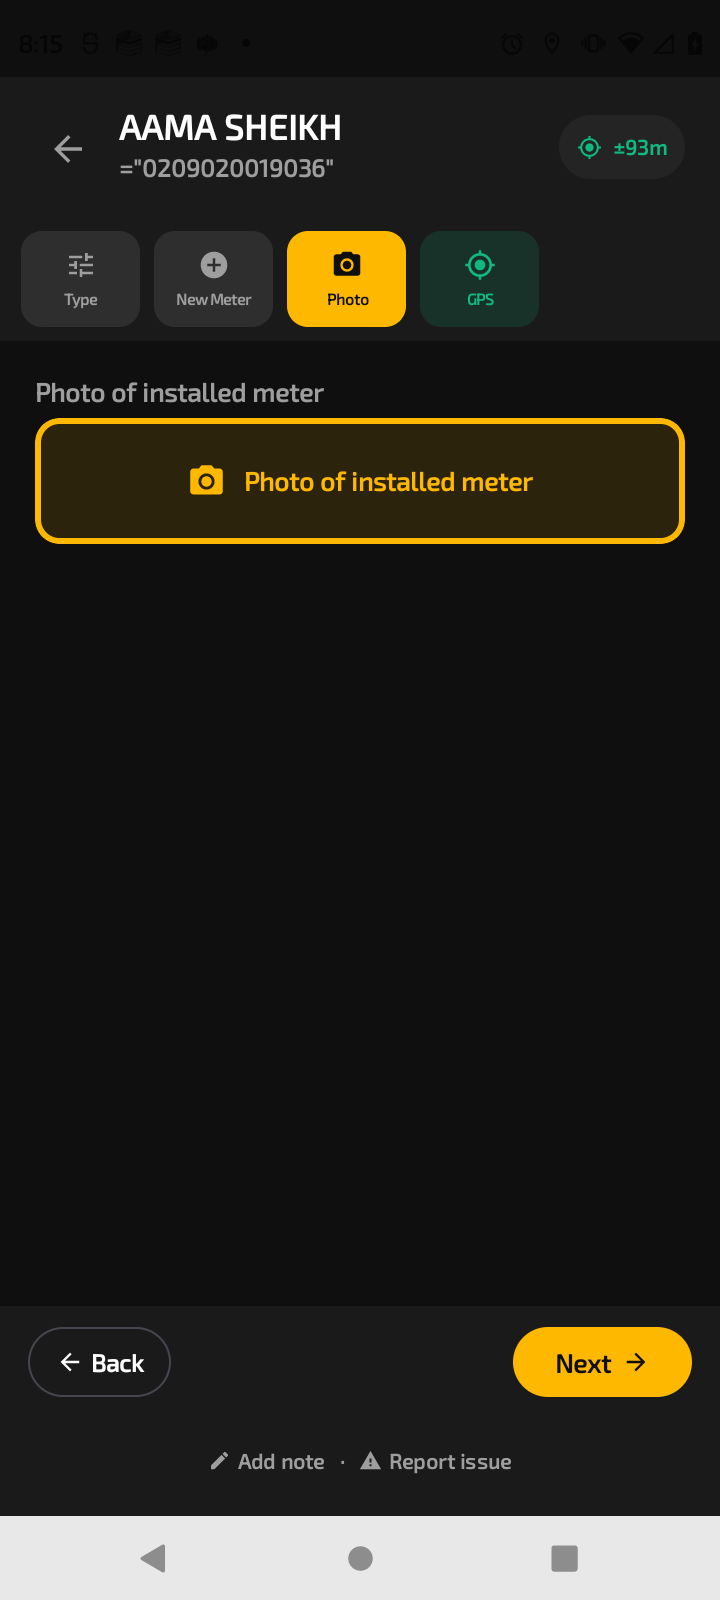
Photograph the install
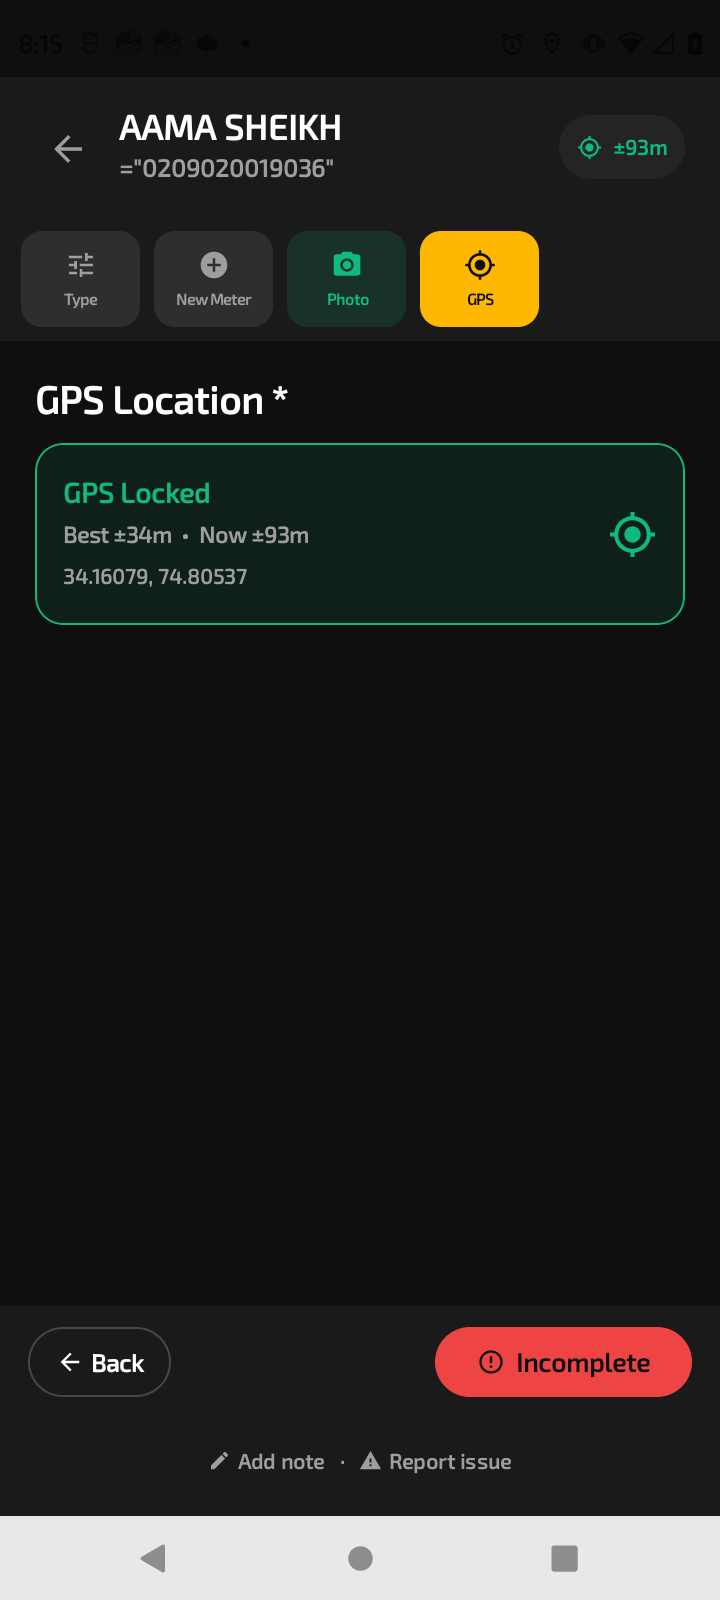
Lock the GPS
Live, in production, and open to explore.
More systems, more sectors.
Every one solved a problem that direct integration couldn't. Click any story for the full picture.
Building the Dome —
61 Isolated Data Centers, One Unified Layer
61 isolated legacy data centers. No central visibility. Consumer data locked away. Audits impossible. Zero consumer-facing services.
A unified intelligence layer above the DCs — consumer apps, online payments, dashboards, and mobile field inspection. Ran flawlessly for 10 years.
The Problem
A national energy operation ran 61 independent, legacy data centers — each an island. There was no central view of consumers, no way to audit across regions, and not a single consumer-facing service. Direct integration was impossible: incompatible stacks, strict security boundaries, decades of accumulated divergence.
What We Built
Rather than replace the data centers, we built an intelligence layer above them — a unified dome that read from all 61 without disturbing them. On top of that layer: a consumer app, online payments, management dashboards, and a mobile app for field inspection teams.
The Outcome
For the first time, the organisation had one view of every consumer and every region — and consumers had digital services they'd never had before. The platform ran in production for 10 years.
Smart Meter Rollout:
From Black Box to Full Visibility
Installation data moved between teams manually — no visibility, no accountability, consumers lost in the system.
Real-time upload, automated sanitisation, live progress tracking, and error reporting keyed to process numbers.
The Problem
Smart-meter installation data had to travel from the installation team to the billing team before a consumer's new meter appeared in billing. That handoff was entirely manual — spreadsheets, emails, follow-up calls — with offline data sanitisation adding delay and error. Errors were silently dropped; some consumers never saw their new meter in billing at all. Direct API integration was impossible due to disparate stacks and strict security policies.
What We Built
An instant on-site upload portal for installers, server-side automated sanitisation, a download portal for the billing team to pull processed data and report progress, and a process-reference number on every record so errors could be traced to their source and attributed to a team.
The Outcome
For the first time, management could see exactly where any activation stood, which team held it, and whether it was on track. Bottlenecks became visible and attributable, error rates dropped sharply, and post-launch there were zero lost meter activations.
The Outreach Pulse System
A high-growth agency spent 15 hours weekly manually checking email deliverability across 40+ separate accounts.
An autonomous monitoring engine — custom APIs plus AI classification — flags low-performing accounts in real time.
The 4% Bounce Rate Alert
An international retailer was losing conversion momentum with no visibility into traffic anomalies.
An intelligent 4% threshold bounce-alert system, integrated directly into core operations.
The capabilities behind the work.
Your operation is the next story.
Bring us the problem direct integration can't solve. We'll architect the system that does.